Note
Go to the end to download the full example code.
Sample selection in NearMiss#
This example illustrates the different way of selecting example in
NearMiss.
# Authors: Guillaume Lemaitre <g.lemaitre58@gmail.com>
# License: MIT
print(__doc__)

import seaborn as sns

sns.set_context("poster")
We define a function allowing to make some nice decoration on the plot.
def make_plot_despine(ax):
    sns.despine(ax=ax, offset=10)
    ax.set_xlim([0, 3.5])
    ax.set_ylim([0, 3.5])
    ax.set_xticks(np.arange(0, 3.6, 0.5))
    ax.set_yticks(np.arange(0, 3.6, 0.5))
    ax.set_xlabel(r"$X_1$")
    ax.set_ylabel(r"$X_2$")
    ax.legend(loc="upper left", fontsize=16)
We can start by generating some data to later illustrate the principle of
each NearMiss heuristic rules.
import numpy as np

rng = np.random.RandomState(18)

X_minority = np.transpose(
    [[1.1, 1.3, 1.15, 0.8, 0.8, 0.6, 0.55], [1.0, 1.5, 1.7, 2.5, 2.0, 1.2, 0.55]]
)
X_majority = np.transpose(
    [
        [2.1, 2.12, 2.13, 2.14, 2.2, 2.3, 2.5, 2.45],
        [1.5, 2.1, 2.7, 0.9, 1.0, 1.4, 2.4, 2.9],
    ]
)
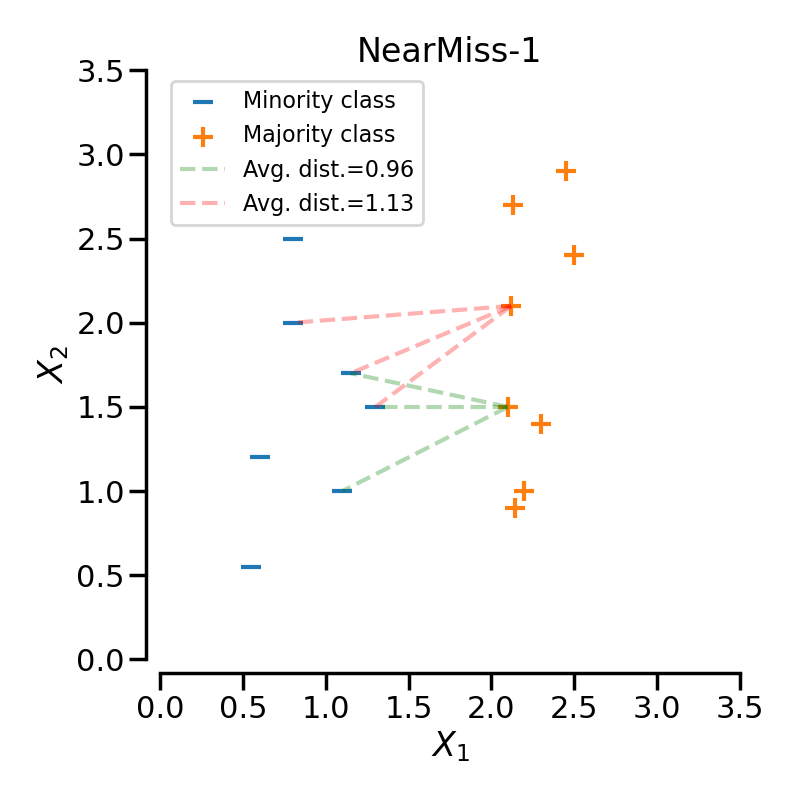
NearMiss-1#
NearMiss-1 selects samples from the majority class for which the average distance to some nearest neighbours is the smallest. In the following example, we use a 3-NN to compute the average distance on 2 specific samples of the majority class. Therefore, in this case the point linked by the green-dashed line will be selected since the average distance is smaller.
import matplotlib.pyplot as plt
from sklearn.neighbors import NearestNeighbors

fig, ax = plt.subplots(figsize=(8, 8))
ax.scatter(
    X_minority[:, 0],
    X_minority[:, 1],
    label="Minority class",
    s=200,
    marker="_",
)
ax.scatter(
    X_majority[:, 0],
    X_majority[:, 1],
    label="Majority class",
    s=200,
    marker="+",
)

nearest_neighbors = NearestNeighbors(n_neighbors=3)
nearest_neighbors.fit(X_minority)
dist, ind = nearest_neighbors.kneighbors(X_majority[:2, :])
dist_avg = dist.sum(axis=1) / 3

for positive_idx, (neighbors, distance, color) in enumerate(
    zip(ind, dist_avg, ["g", "r"])
):
    for make_plot, sample_idx in enumerate(neighbors):
        ax.plot(
            [X_majority[positive_idx, 0], X_minority[sample_idx, 0]],
            [X_majority[positive_idx, 1], X_minority[sample_idx, 1]],
            "--" + color,
            alpha=0.3,
            label=f"Avg. dist.={distance:.2f}" if make_plot == 0 else "",
        )
ax.set_title("NearMiss-1")
make_plot_despine(ax)
plt.tight_layout()
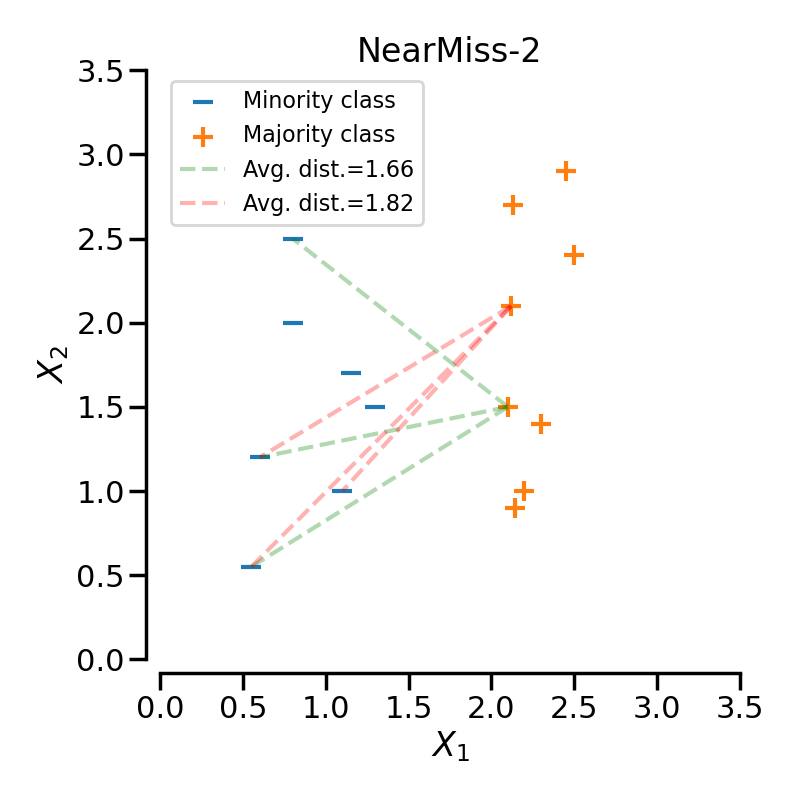
NearMiss-2#
NearMiss-2 selects samples from the majority class for which the average distance to the farthest neighbors is the smallest. With the same configuration as previously presented, the sample linked to the green-dashed line will be selected since its distance the 3 farthest neighbors is the smallest.
fig, ax = plt.subplots(figsize=(8, 8))
ax.scatter(
    X_minority[:, 0],
    X_minority[:, 1],
    label="Minority class",
    s=200,
    marker="_",
)
ax.scatter(
    X_majority[:, 0],
    X_majority[:, 1],
    label="Majority class",
    s=200,
    marker="+",
)

nearest_neighbors = NearestNeighbors(n_neighbors=X_minority.shape[0])
nearest_neighbors.fit(X_minority)
dist, ind = nearest_neighbors.kneighbors(X_majority[:2, :])
dist = dist[:, -3::]
ind = ind[:, -3::]
dist_avg = dist.sum(axis=1) / 3

for positive_idx, (neighbors, distance, color) in enumerate(
    zip(ind, dist_avg, ["g", "r"])
):
    for make_plot, sample_idx in enumerate(neighbors):
        ax.plot(
            [X_majority[positive_idx, 0], X_minority[sample_idx, 0]],
            [X_majority[positive_idx, 1], X_minority[sample_idx, 1]],
            "--" + color,
            alpha=0.3,
            label=f"Avg. dist.={distance:.2f}" if make_plot == 0 else "",
        )
ax.set_title("NearMiss-2")
make_plot_despine(ax)
plt.tight_layout()
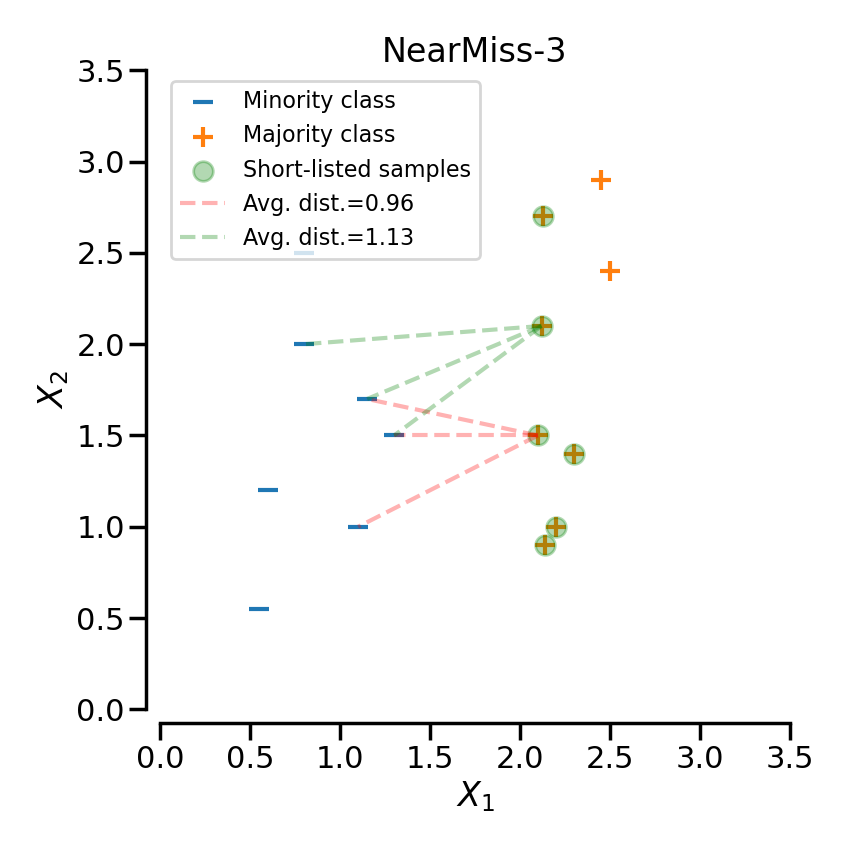
NearMiss-3#
NearMiss-3 can be divided into 2 steps. First, a nearest-neighbors is used to short-list samples from the majority class (i.e. correspond to the highlighted samples in the following plot). Then, the sample with the largest average distance to the k nearest-neighbors are selected.
fig, ax = plt.subplots(figsize=(8.5, 8.5))
ax.scatter(
    X_minority[:, 0],
    X_minority[:, 1],
    label="Minority class",
    s=200,
    marker="_",
)
ax.scatter(
    X_majority[:, 0],
    X_majority[:, 1],
    label="Majority class",
    s=200,
    marker="+",
)

nearest_neighbors = NearestNeighbors(n_neighbors=3)
nearest_neighbors.fit(X_majority)

# select only the majority point of interest
selected_idx = nearest_neighbors.kneighbors(X_minority, return_distance=False)
X_majority = X_majority[np.unique(selected_idx), :]
ax.scatter(
    X_majority[:, 0],
    X_majority[:, 1],
    label="Short-listed samples",
    s=200,
    alpha=0.3,
    color="g",
)
nearest_neighbors = NearestNeighbors(n_neighbors=3)
nearest_neighbors.fit(X_minority)
dist, ind = nearest_neighbors.kneighbors(X_majority[:2, :])
dist_avg = dist.sum(axis=1) / 3

for positive_idx, (neighbors, distance, color) in enumerate(
    zip(ind, dist_avg, ["r", "g"])
):
    for make_plot, sample_idx in enumerate(neighbors):
        ax.plot(
            [X_majority[positive_idx, 0], X_minority[sample_idx, 0]],
            [X_majority[positive_idx, 1], X_minority[sample_idx, 1]],
            "--" + color,
            alpha=0.3,
            label=f"Avg. dist.={distance:.2f}" if make_plot == 0 else "",
        )
ax.set_title("NearMiss-3")
make_plot_despine(ax)
plt.tight_layout()
plt.show()
Total running time of the script: (0 minutes 3.477 seconds)
Estimated memory usage: 214 MB